April 9, 2026Web Dashboard
My Energy Dashboard: Solar, Battery and Consumption at a Glance
Node.jsMQTTVictronShellySolarBatterie
Advertising note: This post contains affiliate links (marked with *). If you buy through them, I receive a small commission — the price stays the same for you.
Safety notice — rebuild at your own risk
Mains voltage (230 V): Work on mains-powered parts is life-threatening and must only be carried out by a qualified electrician in compliance with VDE regulations.
Lithium / LiFePO4 batteries: Incorrect wiring, short circuit or improper charging can cause fire, gas release or explosion. Protective electronics (BMS) are mandatory. When in doubt, consult a professional.
Why a Custom Energy Dashboard?
I have a solar system with battery storage. The Victron app shows me data, but I wanted more: all energy flows at a glance, calculate electricity costs, see savings — and all of this in the browser on any device.
Ready-made solutions like Victron VRM Cloud or Home Assistant Energy Dashboard were either too inflexible or couldn't combine all data sources. So I built my own dashboard.
The central question: What does my electricity really cost, and how much do I save with solar + battery?
Data Sources: Victron, Shelly & JK-BMS
The dashboard combines three systems that otherwise work separately:
Victron Venus OS: Provides solar yield, battery SOC, charge/discharge currents and inverter power. All via MQTT — Victron provides this out of the box.
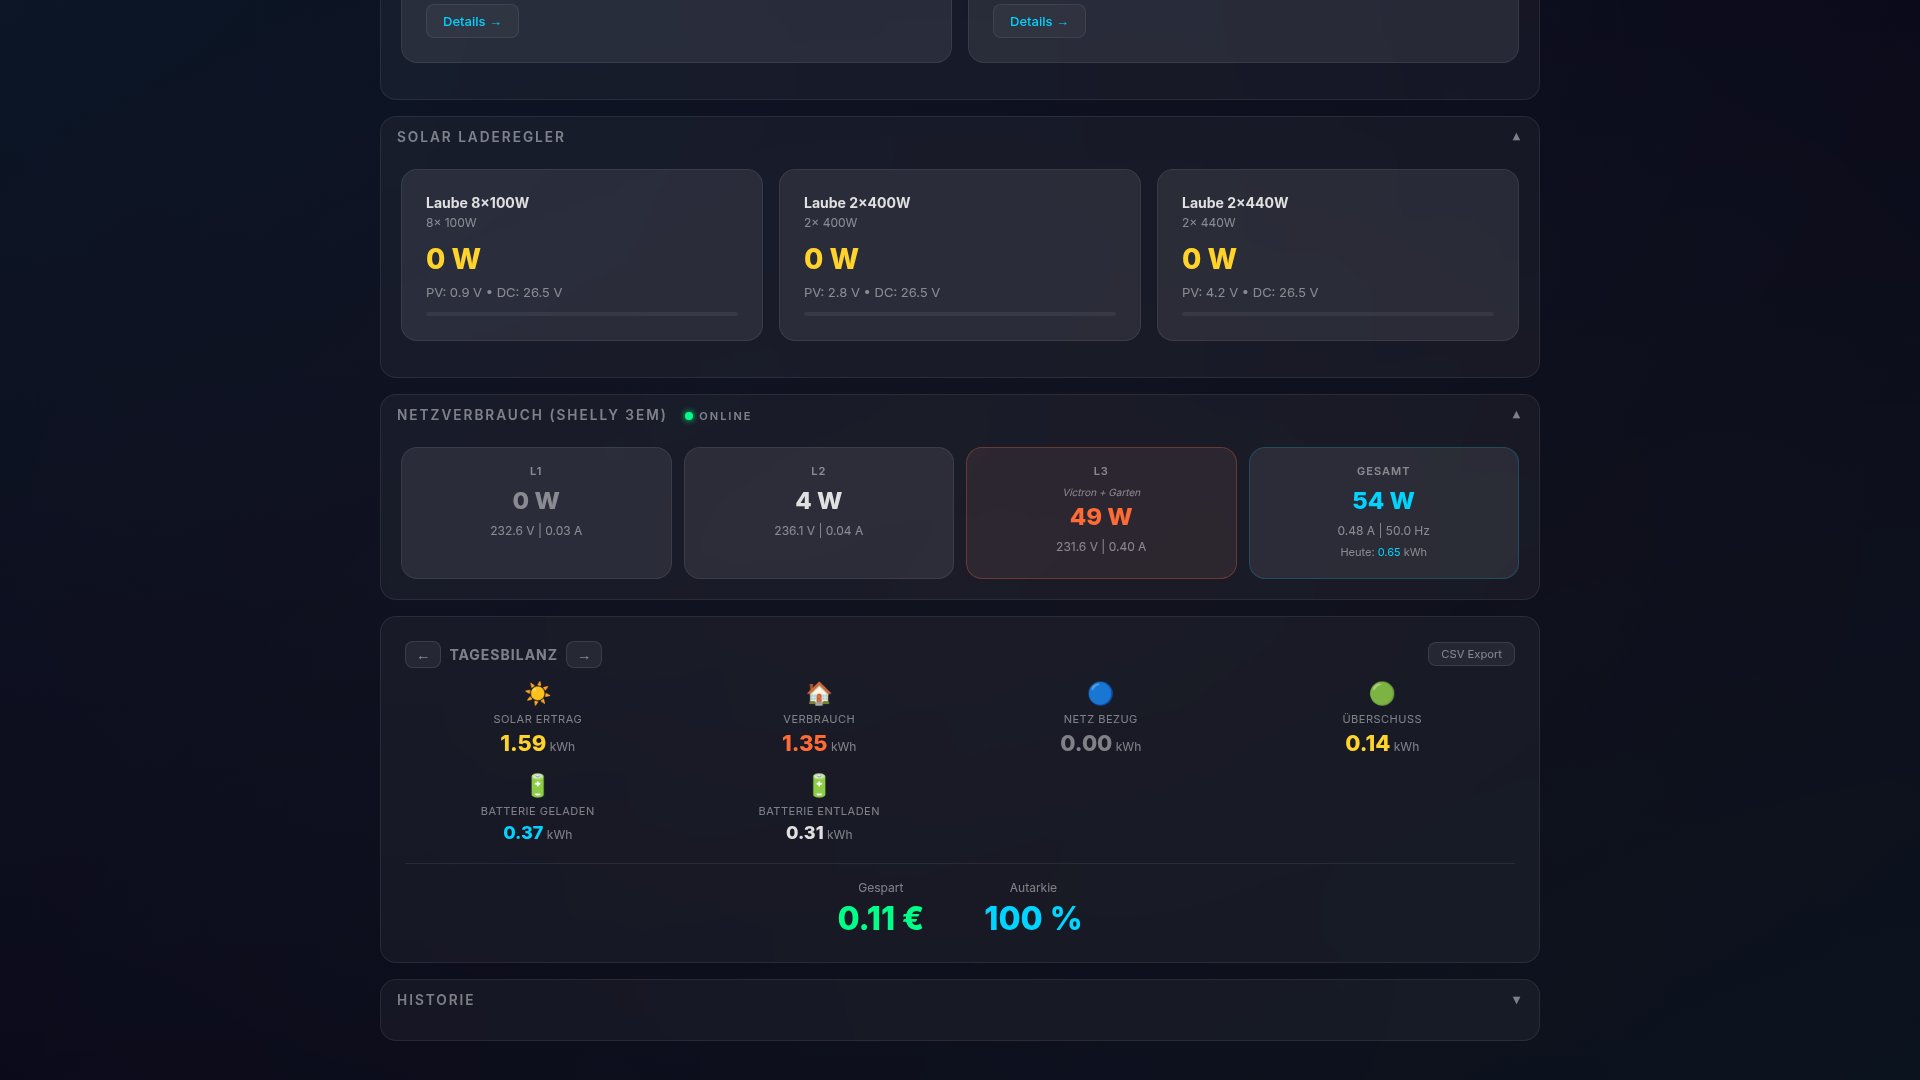
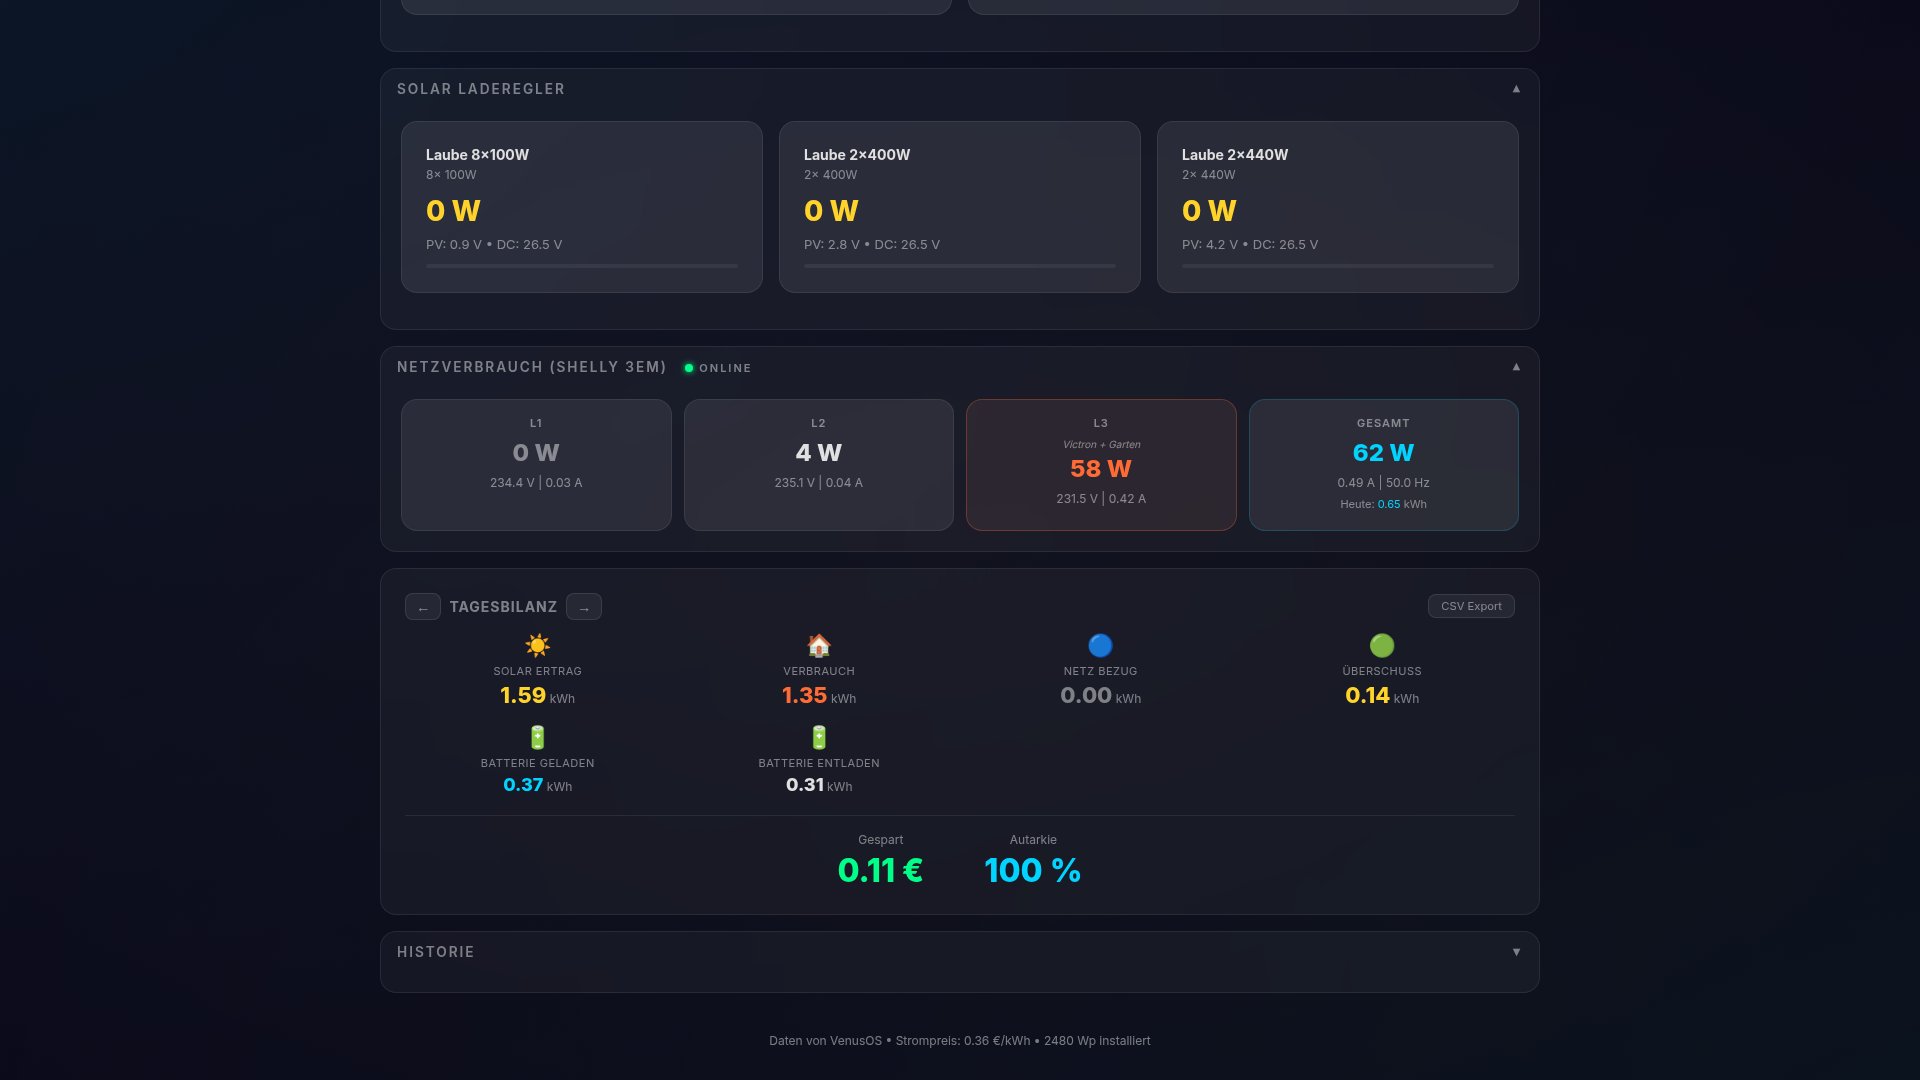
Shelly Pro 3EM: A three-phase energy meter at the house connection. Measures exact grid consumption and feed-in — what actually comes from the grid and what goes back. Without the Shelly, I wouldn't know what my electricity costs. Shelly Pro 3EM on Amazon*
JK-BMS: The battery management system provides individual cell voltages, temperatures and balancing status. Important to see if the battery is healthy.
All three send their data via MQTT to my server. There it's combined, stored and streamed to the frontend.
Tech Stack: Node.js, MQTT, MongoDB & WebSocket
The stack is intentionally kept simple:
Backend (Node.js + Express): Receives MQTT messages from all three sources, processes and normalizes the data. Calculates costs, self-sufficiency and savings.
Database (MongoDB): Stores historical measurements. This lets me compare days, weeks and months. How much solar did I have in March vs. April?
Real-time (WebSocket): The frontend gets live updates — no polling, no delay. The energy flow updates in real time.
Frontend: Lean web interface with Chart.js for graphs. Responsive, runs on phone, tablet and desktop.
The whole thing runs on my NUC (small home server) and is accessible via my local network.
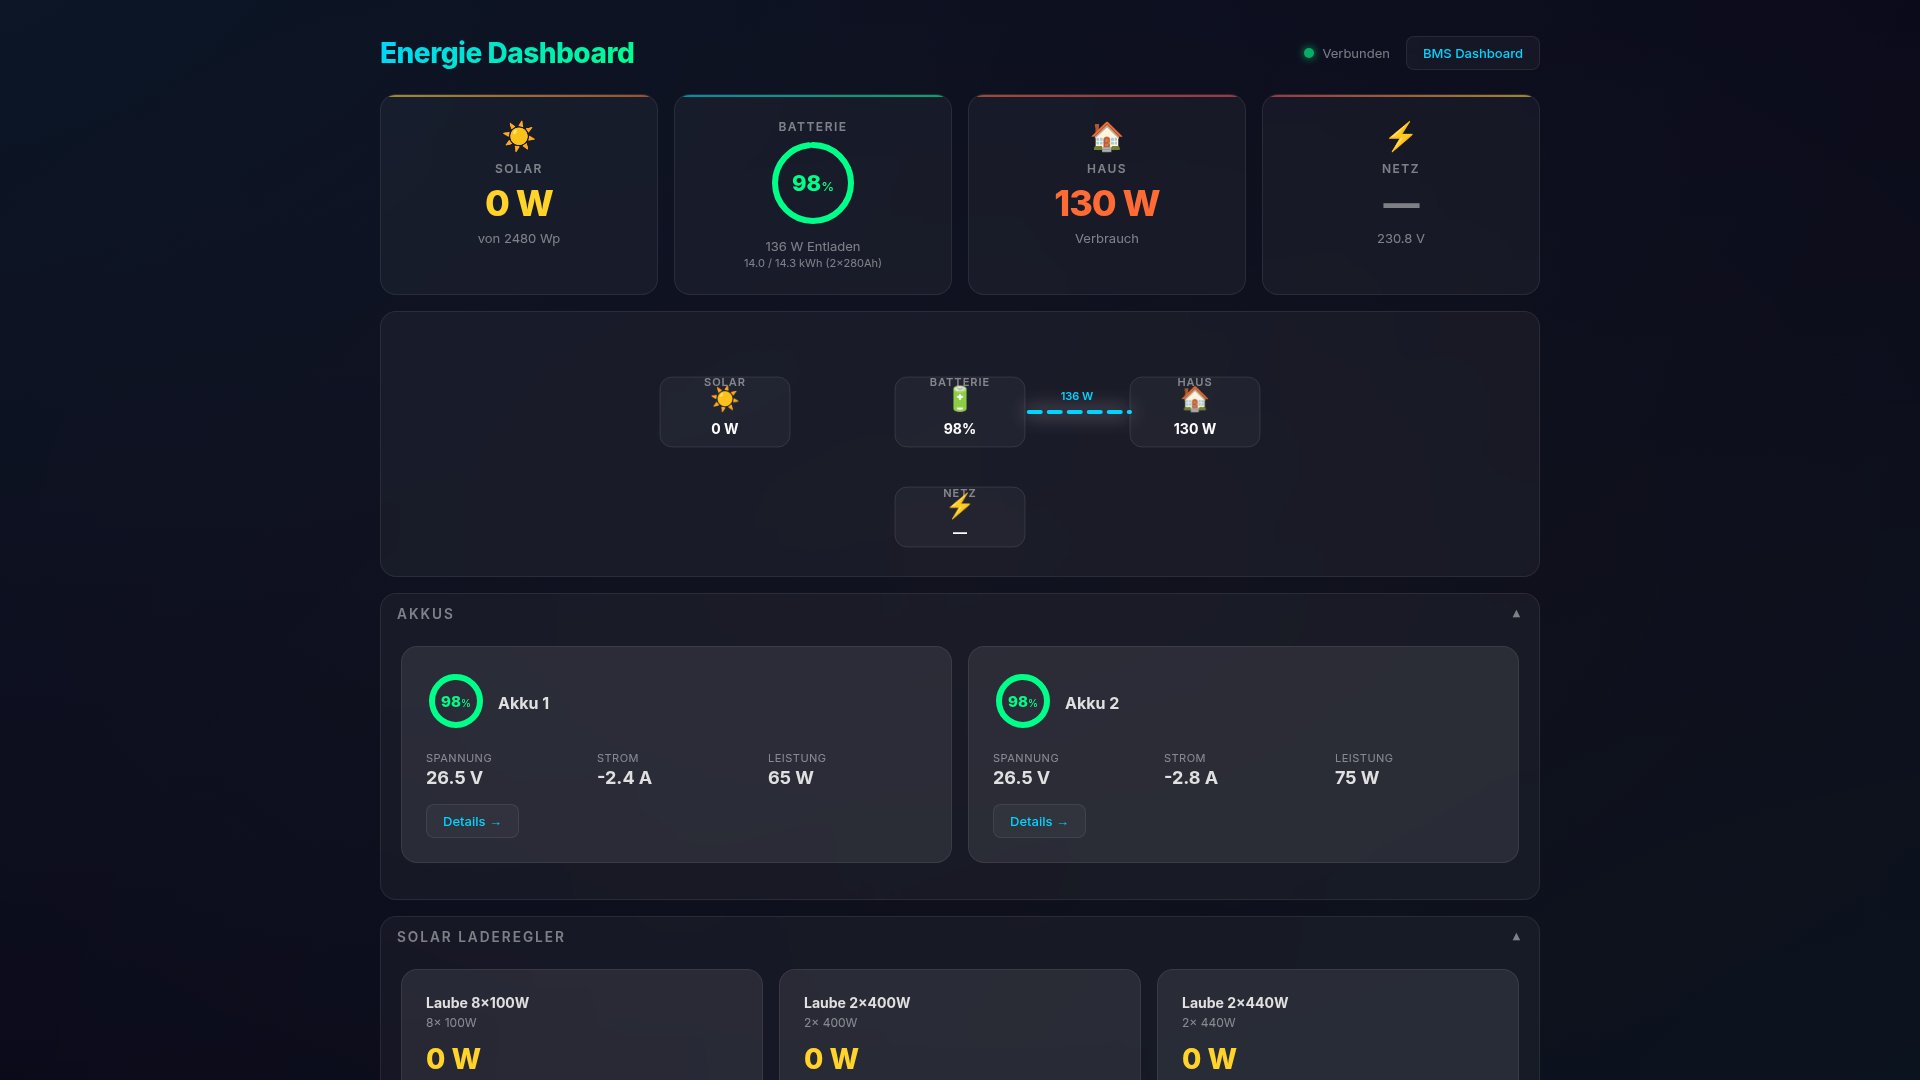
What the Dashboard Shows: Energy Flow in Real Time
The centerpiece is the energy flow visualization: a diagram shows in real time where electricity comes from and where it flows.
Solar → Battery: Sun is shining, battery charges.
Solar → House: Direct consumption from the roof — the cheapest electricity.
Solar → Grid: Surplus is fed in.
Battery → House: Evenings and nights, the battery delivers.
Grid → House: What solar and battery can't cover comes from the grid.
The dashboard also shows:
- Daily balance: Generated vs. consumed, self-sufficiency percentage
- Cost calculation: What would the day have cost without solar? How much did I save?
- Battery health: SOC, cell voltages, temperature — all from the JK-BMS
At a glance I can see: Today was a good solar day, 85% self-sufficiency, saved €2.40.
Learnings: What I Learned Along the Way
MQTT is the key: All three systems speak MQTT. This makes integration simple — subscribe to a topic, parse data, done. No polling, no REST APIs, no latency.
Shelly is worth its weight in gold: Without the Shelly Pro 3EM* at the house connection, I'd have no real cost data. Victron only shows its own side (solar + battery), not what actually comes from the grid.
MongoDB for time series: Works well enough for my purpose. For larger setups I'd use InfluxDB, but MongoDB is easier to set up and I already use it for other projects.
WebSocket instead of polling: The difference is noticeable. The dashboard feels live, not like a page reloading every 5 seconds.
Is Solar with Battery Worth It? My Numbers
The dashboard gives me the answer in hard numbers. On sunny days I reach 80-95% self-sufficiency — almost all electricity consumption comes from solar + battery. In winter it's different, self-sufficiency is at 20-40%.
Calculated over the year, the system saves me significant electricity costs. The dashboard makes this transparent and motivates shifting consumption to sunny hours — washing machine at noon instead of evening.
If you're wondering "Is a solar system with battery storage worth it?" — you only get the answer with real data. And that's what my dashboard delivers.
More technical details about this project:
View Project →* Advertising — Links marked with an asterisk (*) are affiliate links. If you purchase through these links, I receive a small commission — the price stays the same for you.
Mike Sobczinski
Embedded developer and shift worker in the semiconductor industry. Builds IoT solutions with ESP32, LoRa, and Home Assistant — from firmware to dashboard.
Learn more →