September 23, 2026Measurement / Home Assistant
Wood-Fired Oven: The Controller Gives Up Its Display and Gets an LED Matrix
ESP32-S3RP2350HUB75LED MatrixMAX31856ThermocoupleWood-Fired OvenESP-IDFMQTTHome Assistant
Safety notice — rebuild at your own risk
Rebuilds at your own risk. This description is a personal documentation, not a verified build guide — you have to verify suitability for your use case yourself.
Too Small Once You Work at the Oven
In May I posted the initial version of my oven controller: an ESP32-S3 paired with a touch display and two thermocouples, one on the dome and one on the floor. During the summer the display was upgraded, first to 3.5 inches, then in early September to 4.3 inches on an ESP32-P4. It looked great on the desk.
At the oven it took two baking days before I realised it would not work out. The software ran without a fault. But when you load bread or rake out embers, you do not stand 40 cm in front of the case; you stand two or three metres to the side with the peel in your hand. From there a 4.3-inch panel is a bright blob. An even bigger display on the case would not have changed much, because the case sits where the probe cables end, not where I am looking.
I decided to flip the question: why must the measuring device show anything at all?
Measuring and Displaying, Separated
The system now includes two devices.
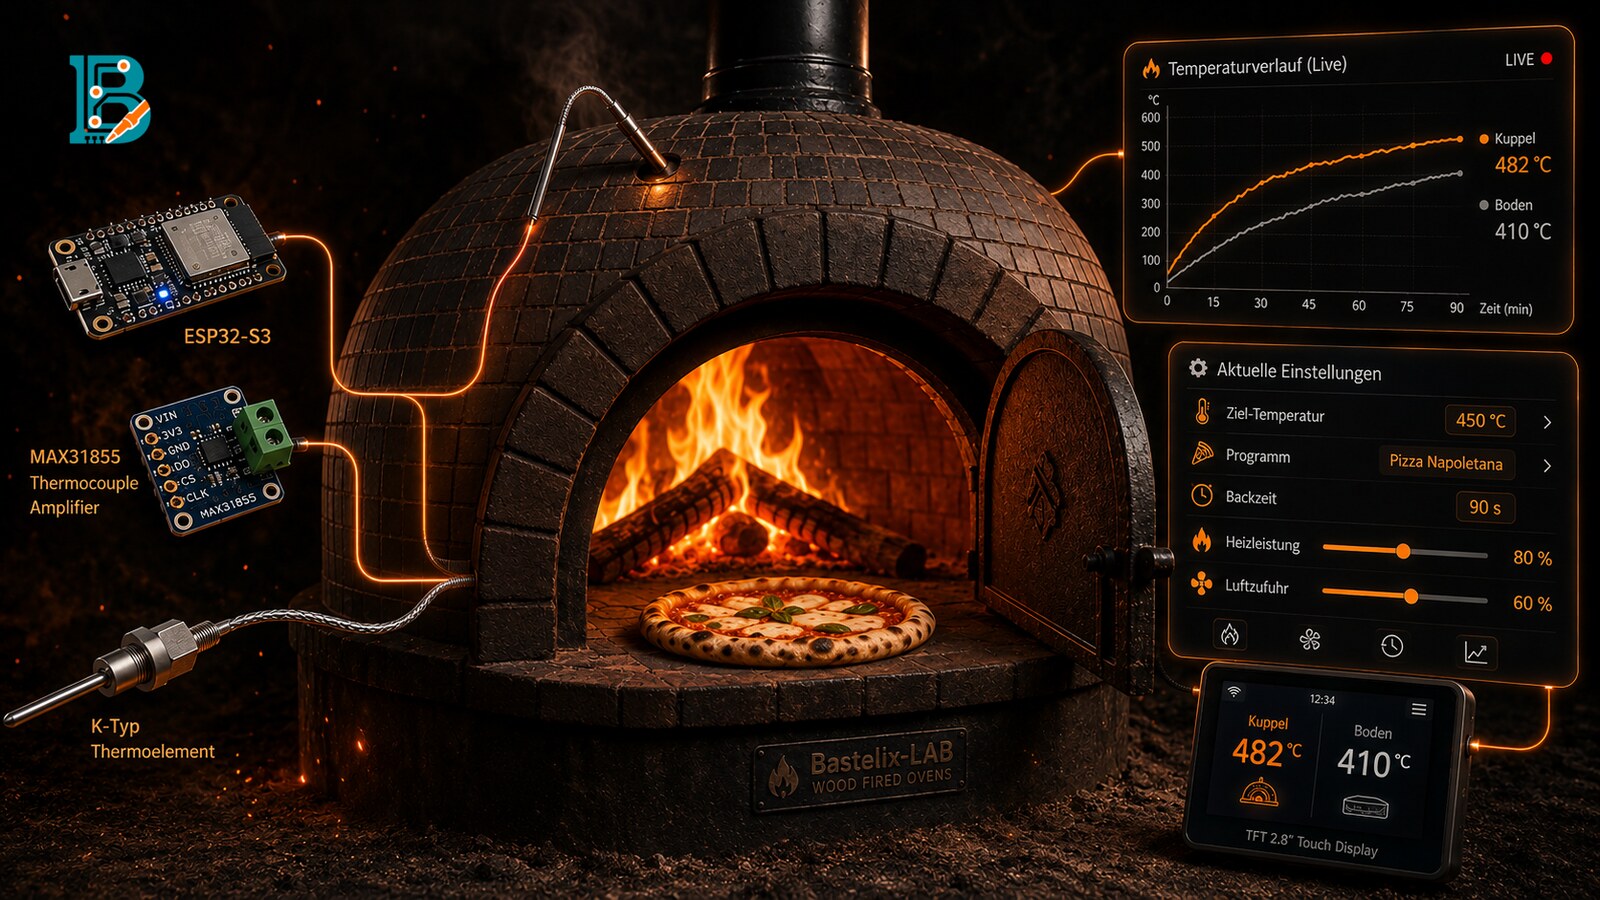
The base unit is an ESP32-S3 (DevKitC-1 with 16 MB flash and 8 MB PSRAM) housed in a closed case at the oven. Two K-type thermocouples are connected to it via a MAX31856 each. I ported the firmware from the P4 and removed the entire display layer, about 2,300 lines of UI code, fonts, and the boot animation. Most of the changes involved deletions. The pinout matches the old S3, so the probe board moved over without any resoldering.
The base unit is the brain: it manages program windows, suggests bake times, predicts cooling, records data, provides a web UI, and talks to Home Assistant via MQTT. This was an intentional decision. The cooling period of a wood-fired oven lasts an entire day, and if the calculations lived in the display, the curve would disappear as soon as I take the display down.
The remote display only listens. Every 2 seconds the base unit broadcasts its full state via UDP, using the same JSON that the web UI receives. There is no broker or router in between. For this the base unit keeps its hotspot up constantly. It needs that anyway: when the router's signal doesn't reach the garden, my phone connects to that hotspot. The display cannot receive commands; it only replies with a heartbeat every 30 seconds so the base unit knows someone is listening.
I examined ESP-NOW and decided to drop it. It would not have taken the place of the hotspot; it would have simply added a second radio path beside it. The packet size is about 415 bytes, which exceeds the 250-byte limit that ESP-NOW can transmit per message. The main reason for dropping it was a different one: my PC can handle UDP as well. A small Python script simulates the base unit, with heating up, the target window, too hot, probe missing, and link loss. The entire display was built on the desk that way, without ever lighting the oven.
64×32 Dots, Three Colours
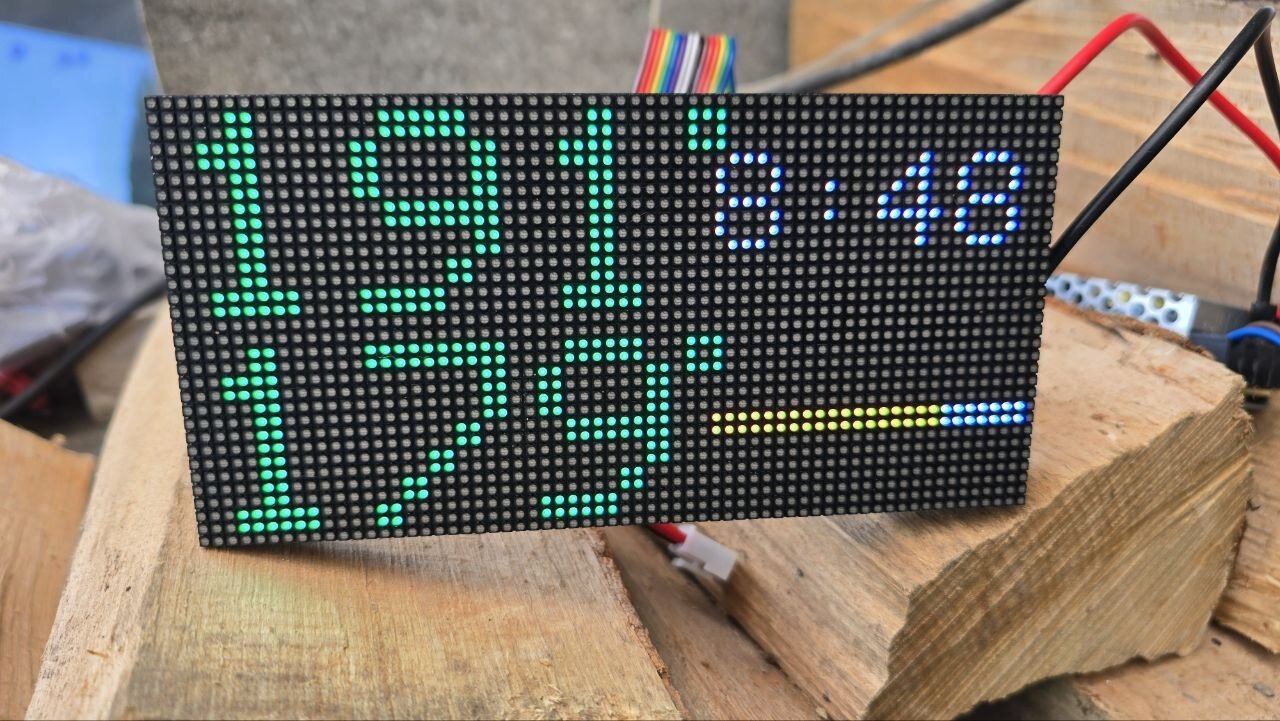
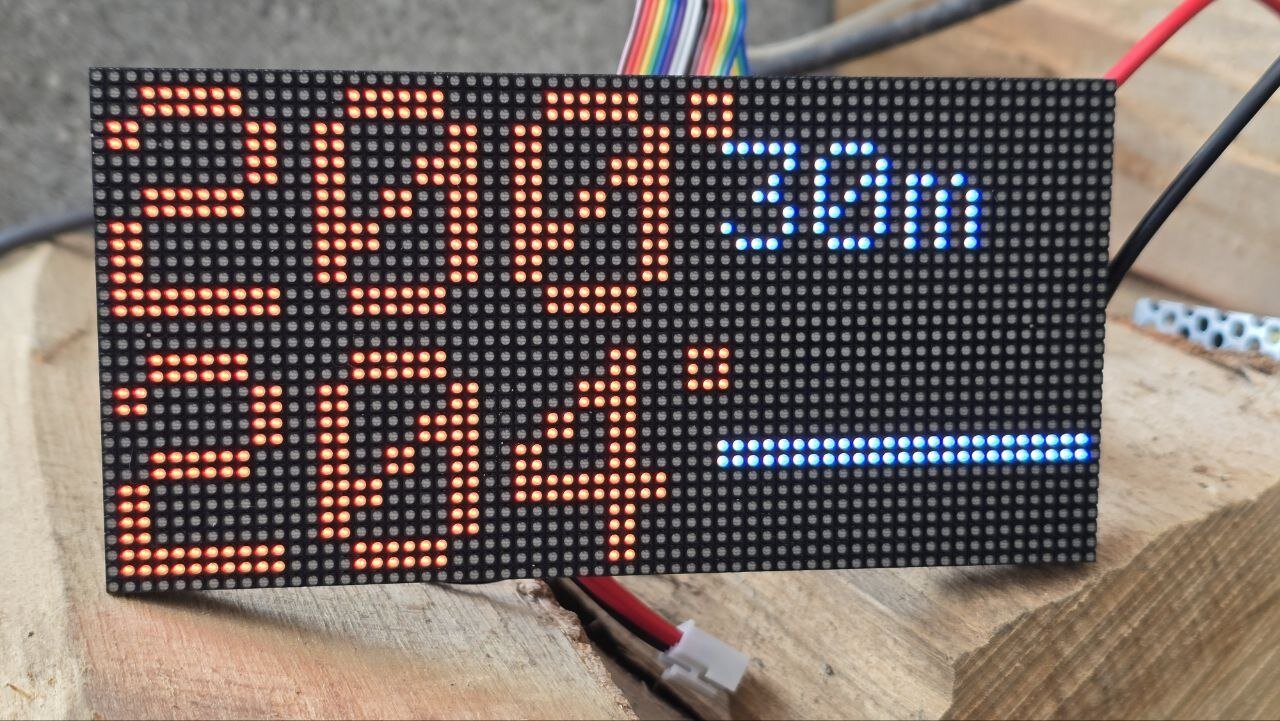
The display uses a Raspberry Pi Pico 2 W paired with a Waveshare HUB75 LED panel: 64 × 32 dots with a 2.5 mm pitch, giving a size of 160 × 80 mm. The panel is driven by Adafruit's Protomatter library. At first a Pimoroni Interstate 75 W was intended, as it includes level shifters and a built-in HUB75 connector. That board was redirected to another project, so the Pico I had built the display around remained. The panel requires its own 5 V power supply; it cannot be powered directly from the Pico.
The digits are about 35 mm tall. They can be read, but the main information comes from the colour. From a few metres away no one will read a digit, but everyone will notice whether the display is blue, green or red. Blue means not there yet. Green shows that it is inside the target window of the chosen program. Red means it is too hot, and only that condition is shown in red. The dome and the floor are evaluated separately. There is no blinking; a blinking panel in the corner of your eye would only be a distraction.
When a bake timer is active, the remaining time appears in the top right corner and a bar below it fills from left to right in orange. The colour is orange instead of red, because a bar running towards red would look like a warning. The timer does not push out either temperature. This was important to me, because it is exactly during baking that the floor decides between done and burnt.
When the oven is cold, the panel changes to a second screen that shows the time, ambient temperature, and humidity, along with three small bars indicating the link to the base unit. It switches to the oven screen at 50 °C and back only below 45 °C; each condition must hold for one minute. Starting a timer brings up the oven screen right away. The brightness is adjusted in the base unit's web UI or in Home Assistant; the display reads it from every packet.
Why the Ambient Sensor Sits on the Display
The base unit calculates a Newton cooling prediction: when the oven will reach 200 °C and when it will reach 100 °C. For this it requires the ambient temperature. Previously the SHT31 sensor was mounted on the controller's case. Now the base unit is inside a closed box, and a sensor inside that box measures the temperature inside. With that value, the prediction would have been useless.
The SHT31 is now mounted on the display, which is suspended in the open air on a short cable outside its enclosure. Its measurement is sent back to the base unit with each heartbeat. I intentionally accept this cost: when the display is off, the cooling prediction and dew point are not shown. The fields remain blank rather than displaying the last outdated value.
Next to it is a DS3231 clock module. When I rebuilt the device I saw that the base unit had no clock at all. For weeks the recordings were named
up404.csv, based on the uptime in seconds. Now the base unit receives its time via NTP; in the garden where there is no internet the web UI sets it when I open the page, and the display has its own clock for the clock screen thanks to the DS3231.The Burnt Pizza
During one of the two baking days with the P4, the display read "ready" and the pizza was black underneath. The infrared thermometer on the floor slab recorded a much higher temperature than the floor probe indicated.
The probe isn't incorrect; it's simply positioned differently. It is located about 1 cm below the surface of the fireclay brick, right in the middle of the floor slab. While the fire is burning, heat moves downward through the stone, so the surface stays warmer than the point beneath it. A rough calculation using the thermal conductivity of dense fireclay shows a temperature difference ranging from 20 K to over 80 K, depending on the intensity of the fire. Additionally, the probe reacts slowly: it takes roughly ten minutes before it registers a change at the surface. When the fire is out and the oven soaks, the temperature gradient disappears and the reading becomes accurate again. Thus, the probe works well for baking bread and cake, but with a live fire for pizza it tends to read too low. The IR thermometer also overstates the temperature, because the glowing dome radiates onto the floor and some of that radiation reflects back into the meter. The actual temperature lies somewhere between these two measurements.
I chose not to set a fixed correction value. That would work for pizza but not for bread. Instead the base unit monitors how quickly the floor reading climbs. A rapid rise indicates a lot of heat is coming, so the message "baking surface hotter than shown" appears: in the web UI next to the floor tile, as a small orange triangle in the floor row of the matrix, and in Home Assistant as its own sensor. The thresholds are only estimates for now. The recording of the burnt pizza was on the P4 and is gone.
Baking Day with Bread and Cake
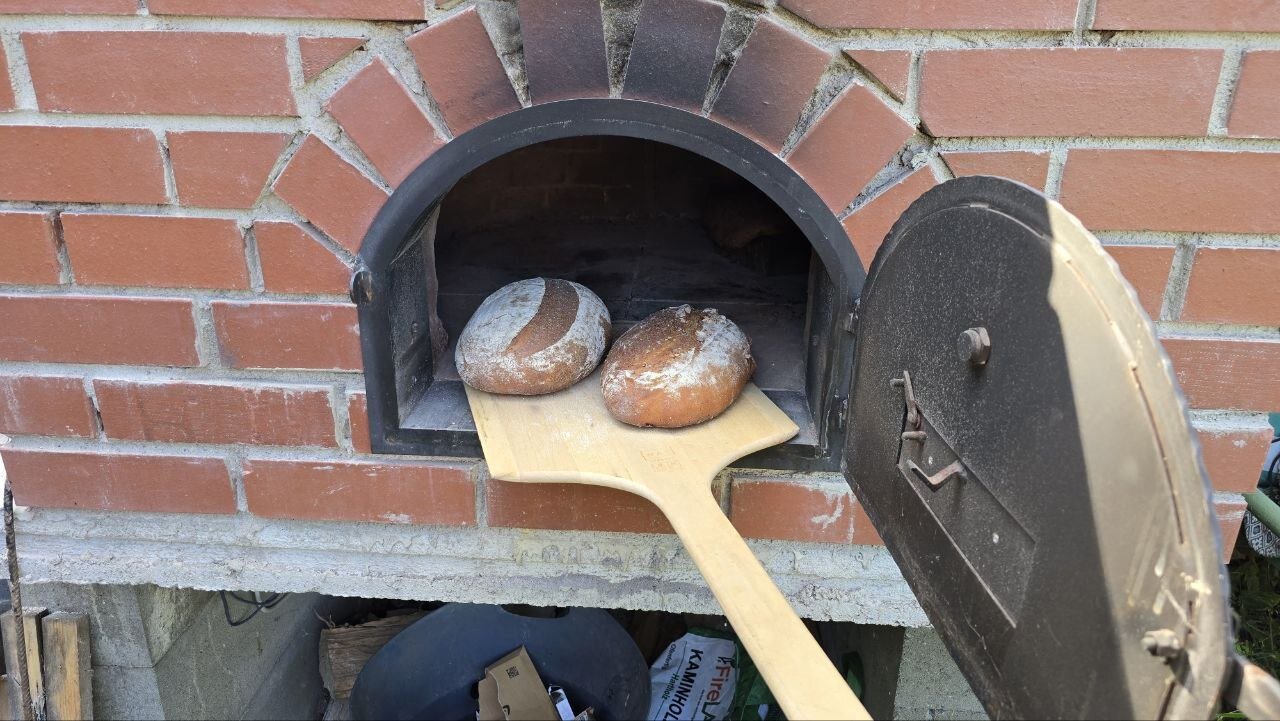
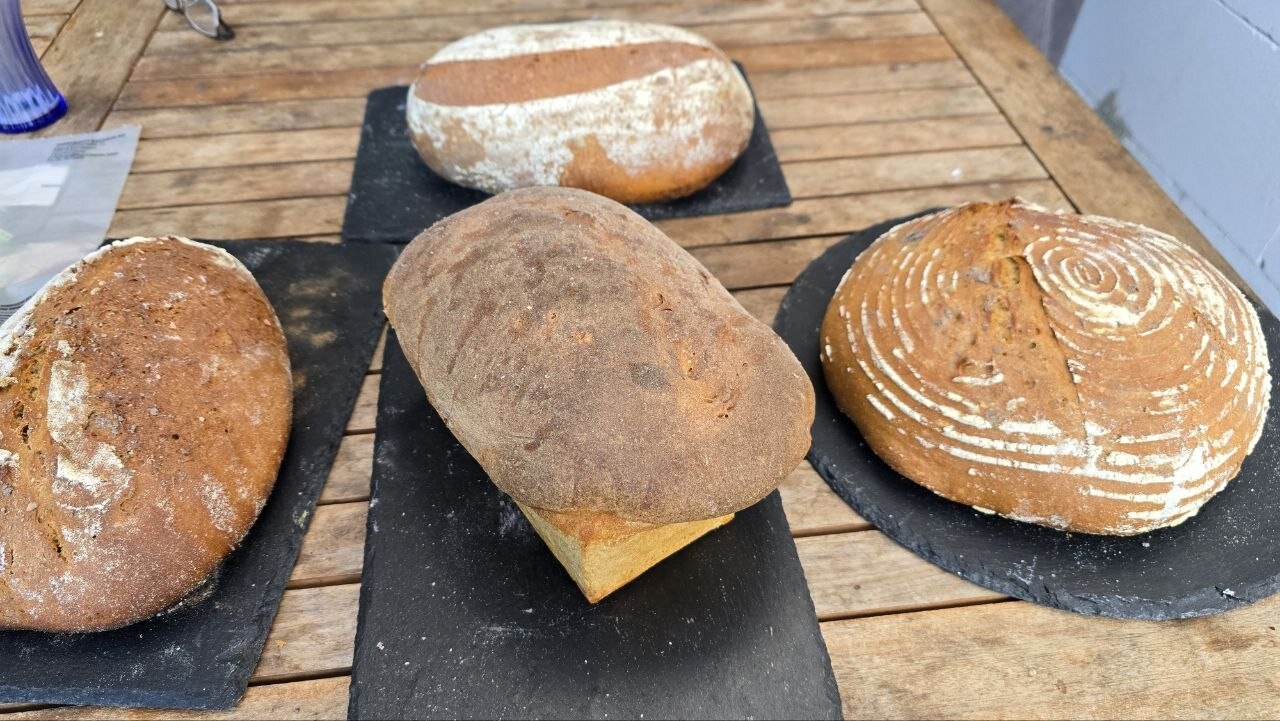
Today was another baking day. I started in the late morning, raising the dome to 638 °C and the floor to 302 °C. First I baked bread, then I made two crumble cakes using the residual heat.
The display hangs within sight, and the colour gives all the information: red means wait, green means go. I only need the numbers when I want more precision. The cake was baked through underneath and not burnt, which after the pizza experience was the real test for me.
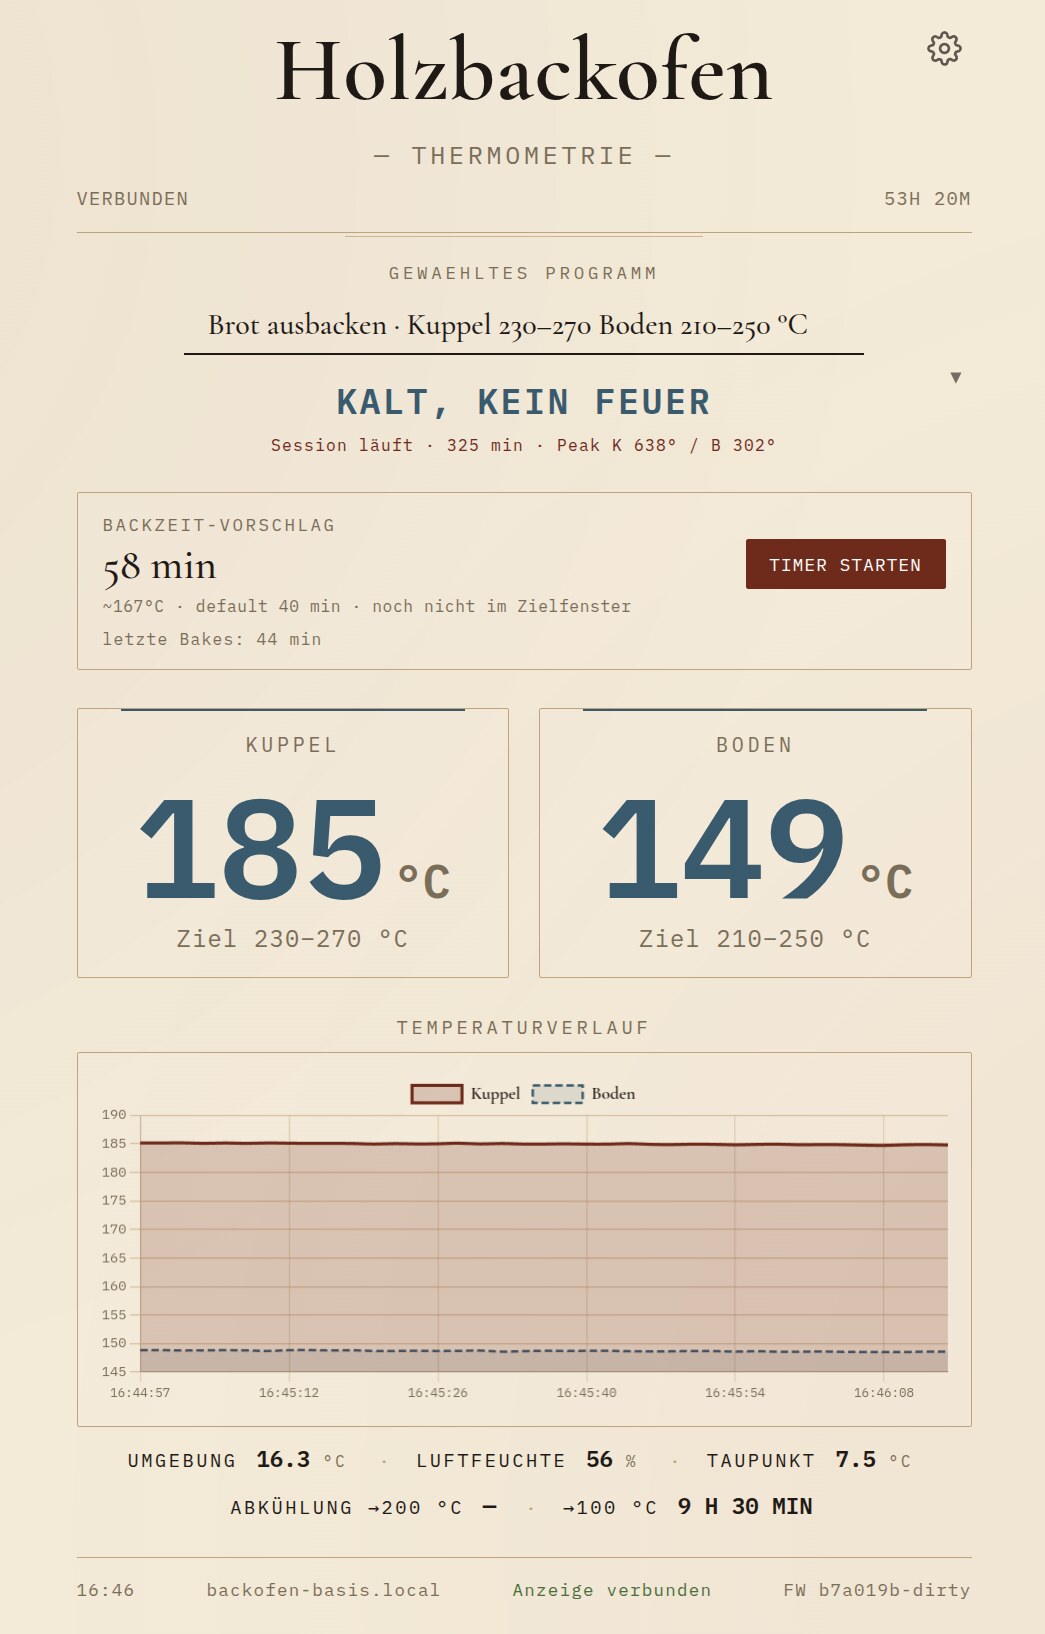
In Home Assistant the entire day appears as a single spike on the 7-day chart. In the afternoon, when the dome reached 185 °C, the cooling forecast still indicated a solid 9 hours until it dropped to 100 °C.
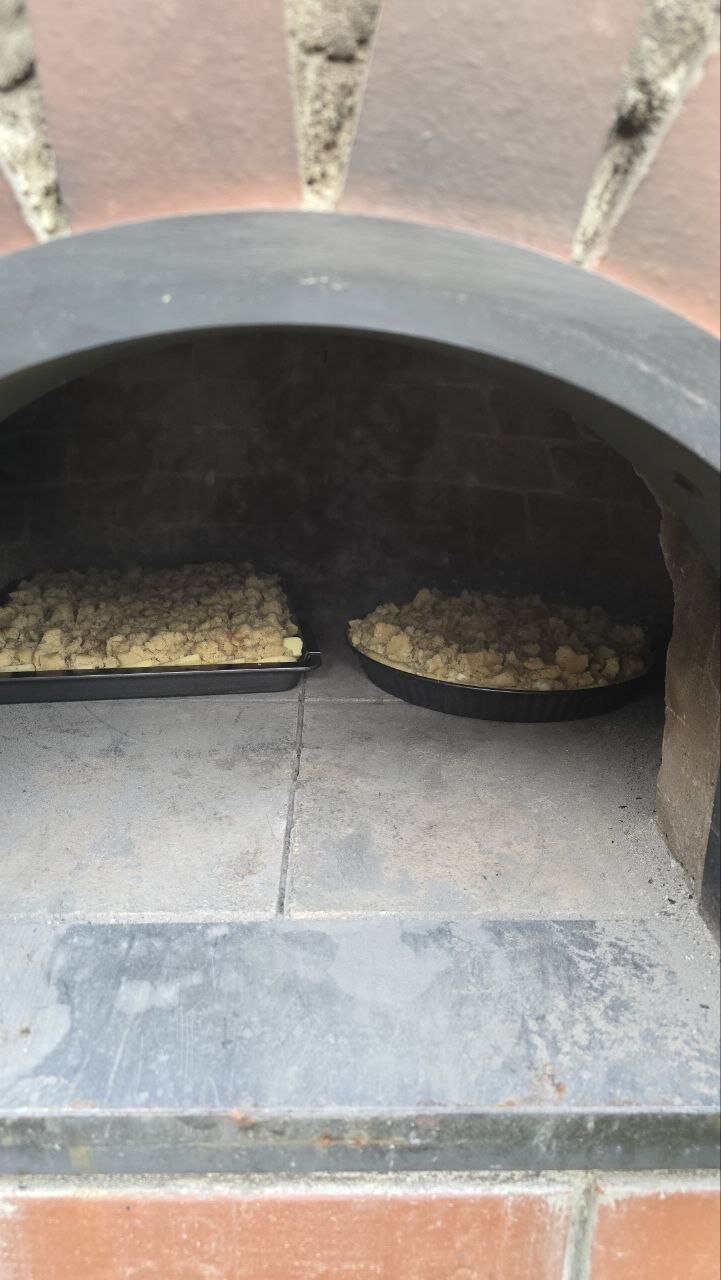
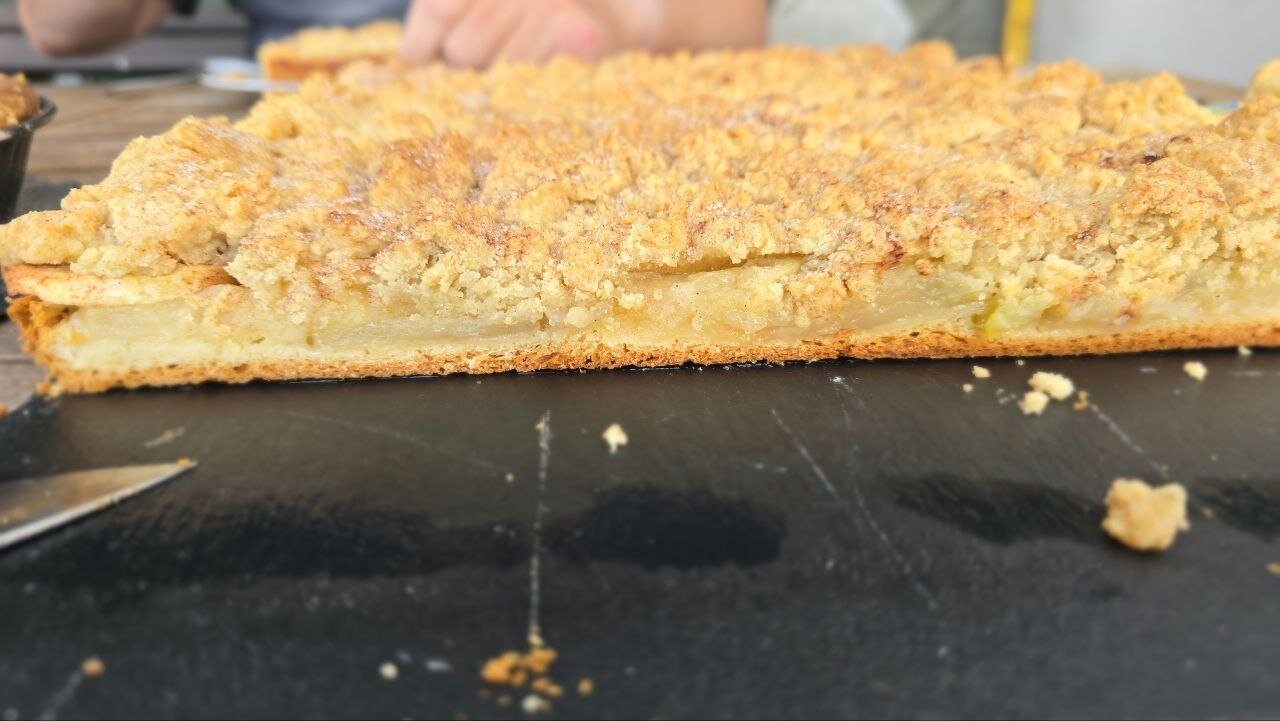
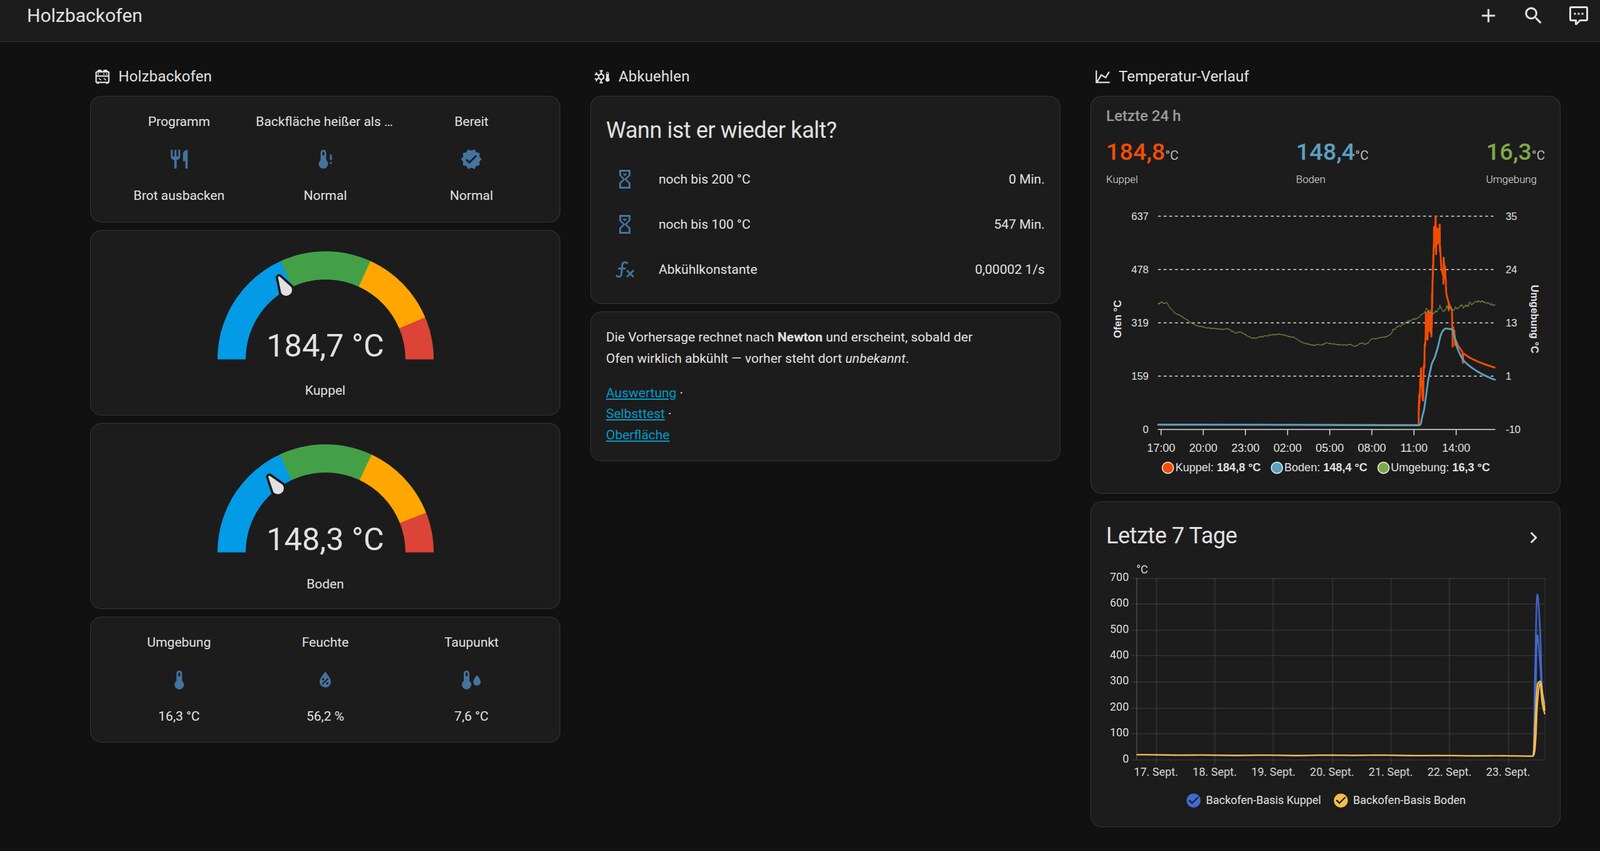
What Did Not Work
The recording is empty. After the baking day I opened the CSV and it contained only the header. The problem was quickly identified as a leftover from the P4. There, writing to flash caused the display to flicker, so the file remains open for the entire firing and the data is written in batches once a minute. The file system (LittleFS) only finalizes new content when the file is closed or explicitly synced; a simple flush does not suffice. The file is closed only after the oven cools below 40 °C, which can take until the next day. Until then, anyone reading the file sees only the header. If power is lost before the file is closed, the entire recording is lost. The base unit no longer has a display that could flicker, so the solution is a single line.
Green and blue were swapped. When the panel first lit up, the two colours were reversed in both halves of the image. The panel's connector is wired differently from the diagram in the manufacturer's wiki, and moving four wires fixed the issue. I now always run the test pattern first before using a new panel. That test pattern, by the way, vanished again after a blink at first, because the second processor core simply painted the normal display over it. Of all things, the tool you use to check wiring looked like a wiring fault itself.
The oven itself. While baking bread I realised that the damper in the flue does not close completely. Heat leaks out there, and more importantly moisture escapes, which is exactly what you want to keep inside the oven for bread. This isn't an electronics issue, but it's something you only notice when you're standing in front of the oven, not at the desk.
What Comes Next
First, I need to fix the recording, because without the CSV I lack the exact material I need next. The floor target windows come from recipes and field reports, and in those contexts "floor" always refers to the surface on which the dough rests. My probe measures 1 cm below that surface. Therefore I want to translate the windows onto the probe's scale: what did the probe read when the bread or pizza actually came out correctly? To do that, the CSV now includes a column showing the timer's remaining time, so you can see when something was in the oven. This only works if I start the timer as soon as the bake goes in.
Next, I will examine the flue damper. A photo of the base unit in its case will be added later; I forgot to take one today.
More technical details about this project:
View Project →
Mike Sobczinski
Trained in automation and computer technology, working full-time in the semiconductor industry. Builds IoT solutions with ESP32, LoRa, and Home Assistant — from firmware to dashboard.
Learn more →